

Your board doesn’t need to know every transaction in the general ledger. That’s not fiduciary oversight. That’s accounting.
What board members actually need is a clear view of the trends that signal whether the organization is healthy, at risk, or quietly drifting toward a problem that could have been caught months earlier. Nonprofit board reporting too often swings between two unhelpful extremes: either a 50-page financial packet that no one reads in full, or a one-paragraph summary too thin to support real governance.
Neither produces the strategic dialogue that good boards are capable of having. The answer is a tighter framework. Five specific nonprofit financial KPIs, reviewed every month, give board members the information they need to govern rather than rubber-stamp.
Here’s what those five metrics are and why each one matters.
1. Days of Liquid Operating Reserves
Cash on hand is a number. Days of liquid operating reserves is a story.
The distinction matters. A nonprofit can show $200,000 in the bank and still be three weeks from a cash crisis if payroll, rent, and vendor obligations are running at $80,000 per month.
Days of liquid operating reserves tells you how long the organization can sustain operations without receiving any new revenue. You calculate it by dividing liquid net assets (primarily cash and cash equivalents not subject to donor restrictions) by average monthly operating expenses.
Most financial experts recommend a floor of 90 days. Three months of operating runway gives leadership time to respond to an unexpected grant delay, a major donor who goes quiet, or a revenue shortfall in a seasonal program. Organizations below 30 days are in survival territory. That’s not a bookkeeping problem. It’s a governance problem, and the board needs to see it.
This is one of the first metrics JFW Accounting Services surfaces in any nonprofit financial dashboard. Nonprofit cash flow management starts here.
2. Budget vs. Actual Variance
The approved budget represents the board’s financial plan for the year. Budget vs. actual (BVA) variance shows how faithfully that plan is being executed.
Every organization will see some variance. Programs shift, timing changes, and unexpected costs appear. The goal isn’t zero variance. It’s variance that leadership can explain, and a board culture that expects that explanation when the gap gets wide enough to matter.
A practical threshold is 10 percent: any line item running more than 10 percent over or under budget should come with a brief written note in the board packet.
Without that standard, variances accumulate quietly. A 12-percent revenue shortfall in Q1 that goes unremarked can compound into a structural deficit by Q3.
BVA reporting gives the board an early warning system, every board deserves to see before issues escalate.
3. Program Efficiency Ratio
Donors, grantmakers, and watchdog organizations like Charity Navigator pay close attention to how much of every dollar actually reaches the mission. The program efficiency ratio answers that directly: of total expenses, what percentage goes to program work vs. management and general operations vs. fundraising?
A commonly cited benchmark is 65-75 percent or higher allocated to program services, though this varies by sector and organizational model. The ratio itself is less important than the trend. If program efficiency drops three points over six months without a corresponding explanation, that’s a question for the board to ask.
4. Revenue Diversity Score
A nonprofit that receives 70 percent of its revenue from a single federal grant is one contract renewal away from an existential crisis. Most boards know this in principle. Far fewer track it as a formal metric.
Revenue concentration (or diversification) analysis measures the percentage of total income coming from each source category:
- Government grants and contracts
- Foundation grants
- Individual giving
- Corporate sponsorships
- Earned revenue, and other sources.
Tracking this monthly, or at a minimum quarterly, gives the board visibility into concentration risk before it becomes a headline.
The target isn’t equal distribution across all categories. It’s a portfolio that doesn’t collapse if one stream underperforms. A board that can see this distribution at a glance is positioned to have a genuine strategic conversation about fundraising investment, program expansion, and earned revenue development.
5. Fundraising ROI
Not all fundraising activity is equally productive. Fundraising ROI measures the cost to raise each dollar: fundraising expenses divided by contributions and fundraising-related revenue. A ratio of around $0.20 is often considered strong, while significantly higher ratios may warrant closer review depending on strategy and growth stage.
This metric helps the board make practical decisions about where to invest more energy. Special events are often the most visible fundraising activity and frequently the least efficient on a cost-per-dollar-raised basis. Major gifts and planned giving programs tend to produce the highest ROI over time. Grant writing ROI varies significantly depending on the organization’s capacity and track record with specific funders.
Turning Data into Dialogue With JFW Accounting Services
Five metrics won’t transform board culture on their own. Presentation matters. A dashboard with clear visual indicators, directional arrows, and simple color coding does more to drive board engagement than the same information presented as rows of numbers in a spreadsheet.
Board members who aren’t accountants can read a red indicator and ask the right question. They often can’t parse a 12-column variance report under the pressure of a two-hour meeting.
This is where an outsourced CFO earns its value in the nonprofit context. Preparing these dashboards, interpreting what the numbers mean in plain language, and briefing the board chair or treasurer before meetings are not administrative tasks.
CFO services from JFW Accounting Services are a high-value service that transforms a board from a compliance body into a strategic asset.
If your board has been working from a 50-page packet that no one fully reads, there’s a better way. Board treasurer reports don’t have to be complicated to be credible. Request a Client Assessment to learn how JFW can elevate your nonprofit board reporting.
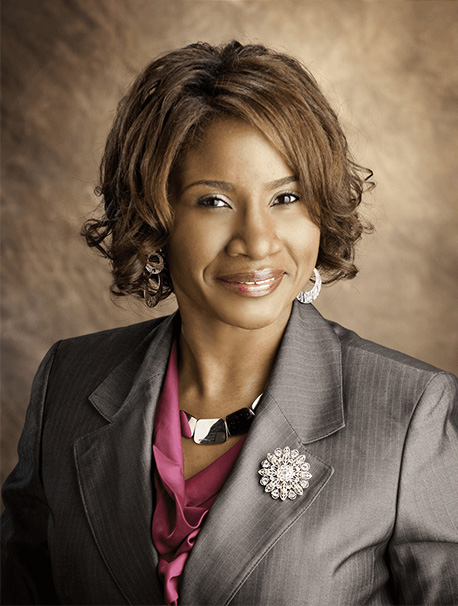
Jo-Anne Williams Barnes, is a Certified Public Accountant (CPA) and Chartered Global Management Accountant (CGMA) holding a Master’s of Science in Accounting (MSA) and a Master’s in Business Administration (MBA). Additionally, she holds a Bachelor of Science (BS) in Accounting from the University of Baltimore and is a seasoned accounting professional with several years of experience in the field of managing financial records for non-profits, small, medium, and large businesses. Jo-Anne is a certified Sage Intacct Accounting and Implementation Specialist, a certified QuickBooks ProAdvisor, an AICPA Not-for-Profit Certificate II holder, and Standard for Excellence Licensed Consultant. Additionally, Jo-Anne is a member of American Institute of Certified Public Accountant (AICPA), Maryland Association of Certified Public Accountants (MACPA), and Greater Washington Society of Certified Public Accountants (GWSCPA) where she continues to keep abreast on the latest industry trends and changes.